



Sales and marketing alignment is the state in which both teams work from shared goals, shared definitions, and a shared understanding of what produces revenue, rather than pursuing separate targets on separate scoreboards. It is supposed to produce one agreed account of what drives the business. In practice, most organizations run the alignment playbook and still get two accounts, because alignment turns out to be a data-architecture outcome rather than a behavioral one.
The SLA was signed eighteen months ago, and both teams still honour it. The MQL definition is documented, agreed upon, and enforced in the system. The joint standup happens every Tuesday, and people actually come.
And in the quarterly review, marketing's slide says the quarter's pipeline came from the demand programme, and sales' slide says it came from outbound and expansion. Both numbers are pulled correctly, from systems that are correctly integrated. Neither team is wrong. Neither team can prove it. And the meeting resolves the way it always resolves: the number gets agreed, the credit gets split roughly by seniority, and everyone goes back to work knowing the question was never actually answered.
What sales and marketing alignment is
Sales and marketing alignment is the condition in which two functions that own different halves of the revenue motion operate against the same objectives, the same definitions, and the same picture of what works.
The clearest description of why it matters is also the oldest, and it has not been improved on. In 2006, Philip Kotler, Neil Rackham and Suj Krishnaswamy published "Ending the War Between Sales and Marketing" in Harvard Business Review, interviewing chief marketing officers and sales vice presidents in pairs. Sales departments, they found, tend to believe marketers are out of touch with what is really happening in the marketplace. Marketing people believe the sales force is myopic, too focused on individual accounts, insufficiently aware of the larger market, and blind to what is coming. In short, "each group undervalues the other's contributions." Both functions stumble, and organizational performance suffers when they are out of sync. And few firms, the authors noted, make serious overtures toward analyzing the relationship at all.
That is the problem, described by the two most authoritative figures in marketing and sales, respectively, twenty years ago. Hold onto the date.
You will also see this called "smarketing", a portmanteau that circulated widely in the 2010s. It names the same thing.
The alignment playbook, and where it genuinely works
The remedies are well established, and they are not wrong. Three practices carry most of the weight.
Shared goals and metrics
Both teams commit to the same revenue target rather than to separate scoreboards, marketing to a pipeline contribution number rather than to lead volume, and sales to a number that acknowledges where the pipeline originates. The related move is a shared definition: what an MQL is, when it becomes an SQL, what "qualified" means in terms both teams would defend in a review. This is real work, and it removes real friction. A documented, enforced MQL definition ends a whole category of argument.
Regular communication and collaboration
The standing meeting, the joint planning session, and the SLA that formalizes what each team owes the other and when. Sales tells marketing what happened to the leads; marketing tells sales what is coming. The practice sounds soft and is not; the alternative is two teams making commitments about each other without asking.
The evidence supports it. Gartner's April 2026 research, from a survey of 227 chief sales officers, found that sales organizations collaborating on enablement content with other functions, such as marketing and service, are 2.4x more likely to achieve strong commercial growth. Cross-functional collaboration works. That is not in dispute here.
Customer journey mapping
Both teams map the actual path a buyer takes, touches, channels, decision points, the handoff, and agree on where each function's responsibility begins and ends. It surfaces the gaps nobody owned, and it usually surfaces at least one assumption each team held about the other that was never true.
Run these three properly, and you get a better-functioning organization. The friction drops. The handoff improves. The arguments become more productive. None of that is nothing, and any account of alignment that skips it is selling something.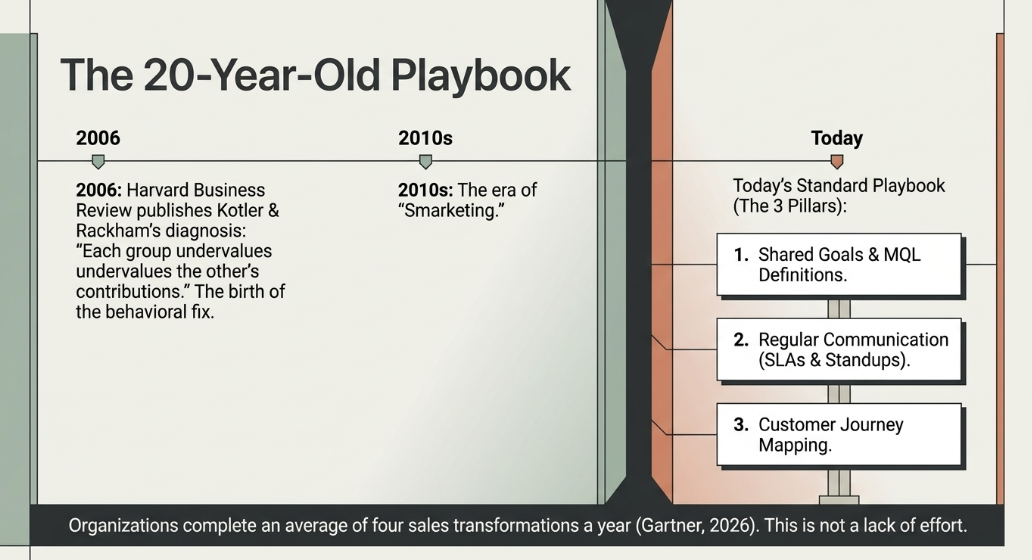
Who does this affect in 2026
If you are a CRO or a VP of RevOps at an enterprise or upper-mid-market company, you have run this playbook. Possibly more than once. Gartner's same survey found sales organizations completed an average of four transformations in the past twelve months. This is not a reader who needs to be told to try harder.
And you still have two numbers in the QBR. The rest of this article is about why, and the answer is not that you ran it badly.
Why does the playbook not finish the job?
Here is the fact worth sitting with. The playbook is twenty years old. It came from Kotler and Rackham. The evidence says it works. Organizations have run it repeatedly, four transformations a year, on average, by Gartner's count. And the reader still walks into the quarterly review with two numbers for the same quarter.
At some point, the persistence of a problem through two decades of correct treatment stops being evidence about the patient and starts being evidence about the diagnosis.
What held then still holds: shared goals, honest communication, and a mapped journey make an organization work better, and the 2006 diagnosis of mutual undervaluation was accurate. What changed is that the fixes have all been applied, and the symptom is still here, which tells you the symptom was never really about goodwill, or meetings, or whether the two teams respect each other. Those were real problems, and they got solved. Something else was underneath.
You are looking at something else if:
- The SLA is honoured, the definitions are agreed, and the two teams still produce different attributions for the same quarter.
- Both numbers survive scrutiny because both are correctly pulled from correctly integrated systems.
- The disagreement recurs every quarter regardless of how well the relationship is going.
- Resolving it requires someone senior to decide, rather than someone analytical to check.
Notice what those have in common: none of them is a relationship failure. They are all the same structural fact wearing different clothes.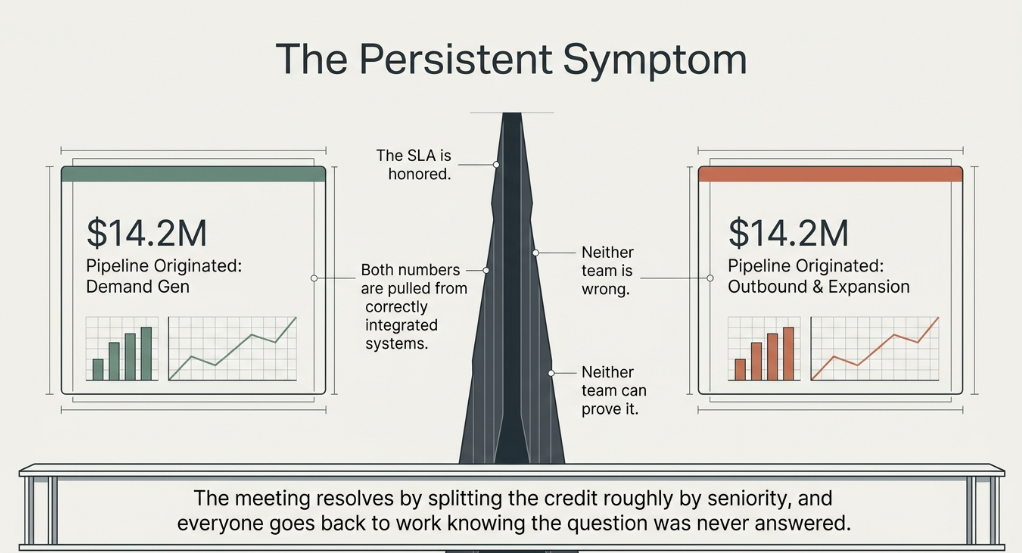
Alignment is a data-architecture outcome, not a behavioral one
The two teams disagree because they are reading two different pictures, and both pictures are accurate.
Marketing holds the top of the motion: campaigns, content, channels, the touches before anyone raised a hand. Sales holds the bottom: conversations, objections, and the expansion that came from a relationship nobody logged. Each function's system holds its own half faithfully. Neither holds the whole. So when the quarter closes, and both teams reconstruct what happened, each reconstructs from the half it has, and each is correct about that half, which is exactly why the argument never resolves. Two teams reading two halves of one revenue picture will disagree in perfect good faith, forever, no matter how good the dashboard is or how well the standup goes.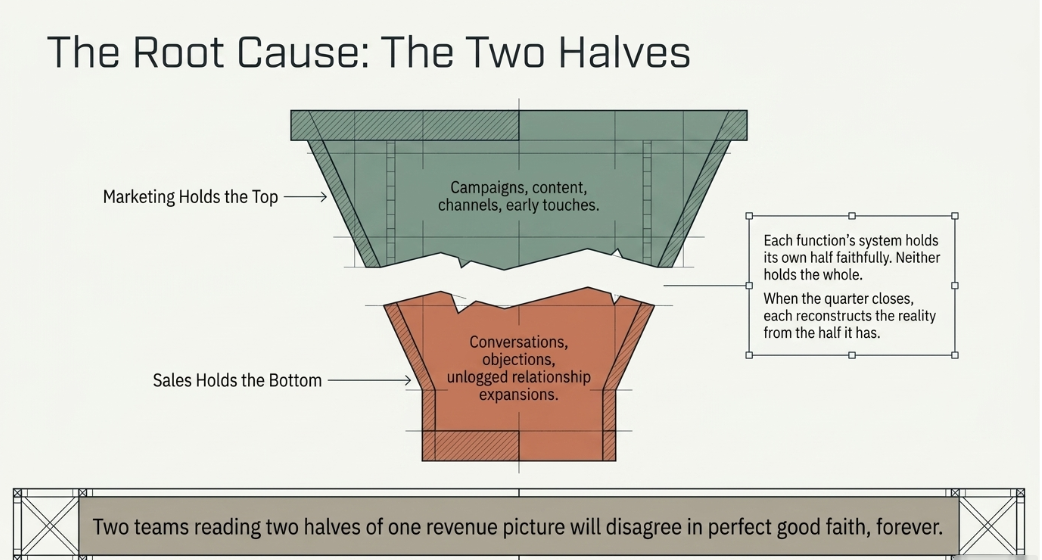
The shared dashboard, which is the playbook's signature artifact, is where this becomes visible rather than where it gets solved. It displays two partial pictures next to each other. Reconciliation is not a display problem.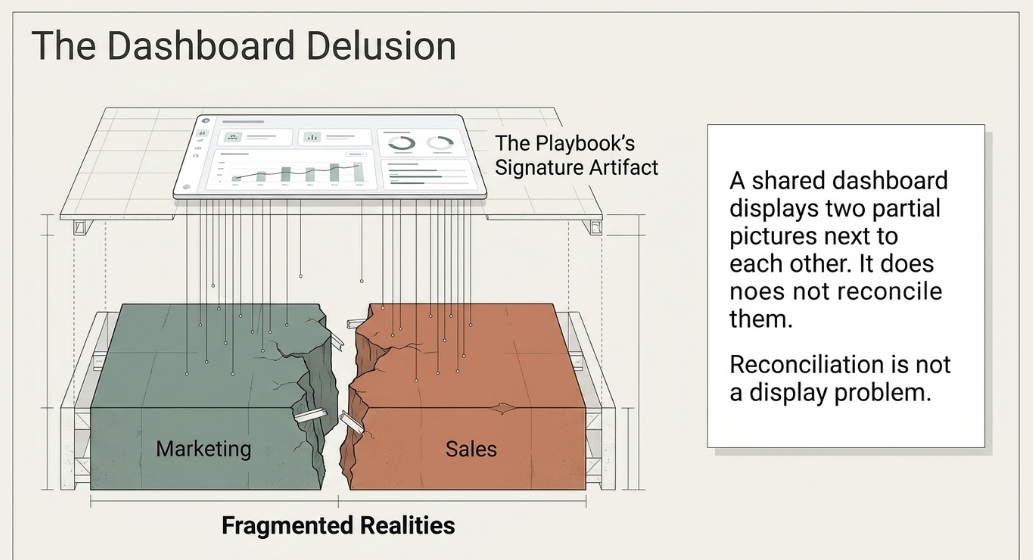
Two analyst houses have arrived at the structural version of this independently. Gartner, sizing the agentic shift at up to $234 billion of enterprise application spend through 2030, reports that enterprise buyers are deemphasizing new tools and dashboards; they want outcomes, and outcomes require systems that retain deep institutional memory and customer context over time. "Agentic AI changes the economics of software," says Gartner's George Brocklehurst. Forrester, predicting 2026, names the remaining bottleneck as business process standardization and data fragmentation, and files it explicitly as a data problem rather than an AI problem.
Neither is writing about sales–marketing alignment. Both are describing their mechanism.
The Revenue Graph: one picture, not two halves
The Revenue Graph is the connected picture of what actually drives revenue, the relationships between touches, signals, accounts, and outcomes, held as one structure rather than divided between the systems that happened to record each part.
That is the thing neither team has. Not a better dashboard over two datasets, and not a third system to reconcile the first two. One picture, in which a campaign touch in March and an outbound conversation in May, and an expansion in August are visible as connected events in a single account's path to revenue, rather than as three claims filed by two departments. Gartner's phrase for what agentic systems require, institutional memory and customer context retained over time, is a description of the same object from the outside.
Once it exists, the QBR question stops being adjudicable by seniority and becomes answerable by inspection. Not because the teams finally agreed, but because there is only one picture to read, and it says what it says. Alignment stops being something the two teams achieve and becomes something the architecture produces.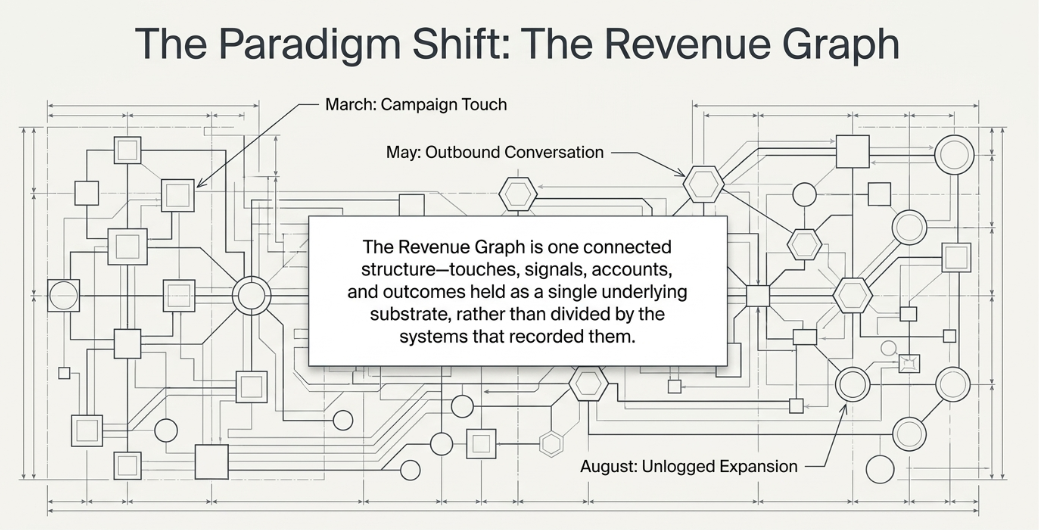
Measuring alignment once the graph exists: Cost per Outcome
The playbook's measurement problem is the same as its alignment problem, one layer down: each team measures activity against its own scoreboard. Marketing counts what marketing did. Sales count what sales did. Both scoreboards are accurate, and neither answers what the business spent to produce a result.
Cost per Outcome is the measure of what it costs to produce a verified revenue outcome, across every function that contributed, rather than what each team produced against its own targets. It only becomes computable once the graph exists, because the outcome and the costs that produced it live in different halves until something connects them. And it makes the alignment question quantitative rather than diplomatic: not whose programme deserves credit, but what the whole motion cost to produce what it produced.
Gartner's finding that buyers want outcomes rather than dashboards is the same shift, arriving in the procurement conversation.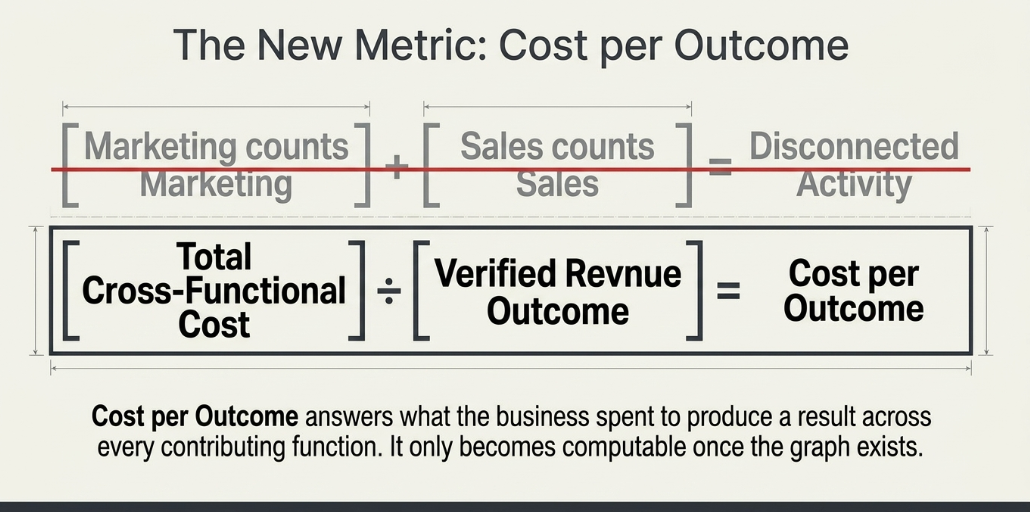
Are your teams reading one picture or two: the decision table
|
The practice |
What it genuinely fixes |
What it cannot fix |
What a Revenue Graph settles |
|
Shared goals and metrics |
Teams pulling toward different targets |
Two correct answers to one attribution question |
Attribution is inspected, not negotiated |
|
Shared MQL/SQL definitions |
Arguments about what counts as qualified |
Whether the qualified thing is what produced revenue |
The path from touch to outcome is one connected record |
|
Regular communication and the SLA |
Surprises, unowned handoffs, unstated assumptions |
A disagreement that neither party can resolve with better manners |
There is one picture, so there is nothing to reconcile |
|
Customer journey mapping |
Gaps nobody owned; false assumptions about the other team |
The map is what you believe happened; it is not what happened |
The graph records the actual path, not the designed one |
|
The shared dashboard |
Visibility into both halves at once |
Two partial pictures displayed together are still two pictures |
One substrate, so one number |
No row says the practice was a mistake. Each shows a practice that correctly solved a behavioral problem, sitting next to a structural problem that it was never scoped to reach.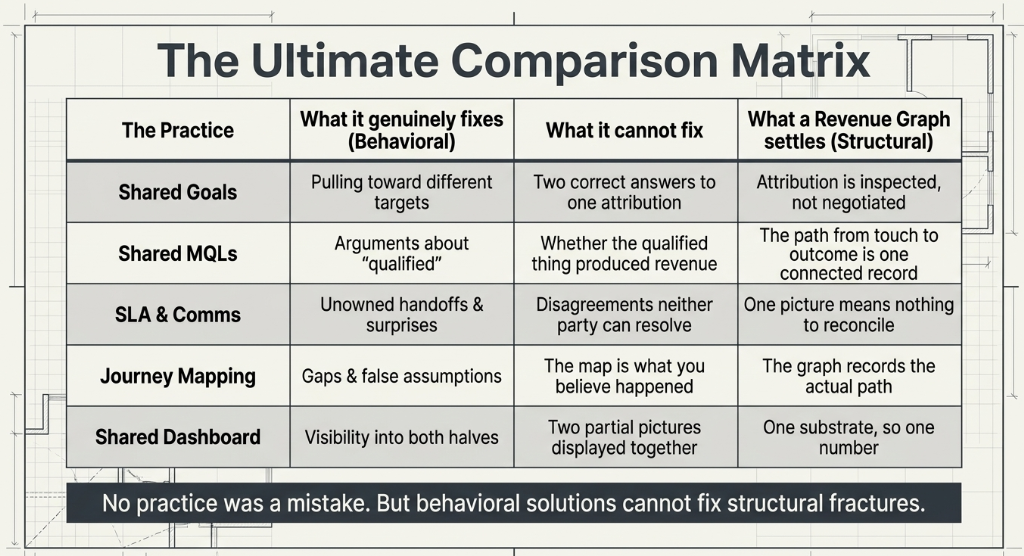
The CETDIGIT perspective
CETDIGIT's position is that alignment has been misdiagnosed for twenty years as a relationship problem, and that this misdiagnosis has cost the people who ran the playbook faithfully more than it has cost anyone else, because when a correct treatment fails, the people who applied it get blamed for how they applied it.
The structural read is more generous and more useful: two functions holding two halves of one picture will produce two answers, and this is a property of the architecture rather than of the people. Which is why we model revenue as a Revenue Graph rather than as two funnels meeting at a handoff. Buying decisions form across channels, functions, and time in ways that neither team's system records completely, and any measure built on half of that, including a very good dashboard over both halves- reproduces the disagreement rather than resolving it. That is the work behind connecting the whole motion to revenue outcomes. We orchestrate that architecture. We are not selling either team a better tool for half.
Recommended path
If your alignment work is done and done well, and the QBR still produces two numbers, that is not a sign to run the playbook again. It is the clearest available evidence that the remaining problem is not the one the playbook addresses.
Start with the QBR itself: take the last one, and ask what it would take for both slides to be generated from the same picture rather than reconciled afterward. The answer usually names the gap precisely. CETDIGIT's AI Revenue Engine practice is where that picture gets built, and the execution layer that acts on it is what turns it from a report into revenue work that happens. Both sit within CETDIGIT's broader AI services framework if you want to see how the pieces connect first.
Frequently asked questions
What is sales and marketing alignment?
Sales and marketing alignment is the state in which both teams work from shared goals, shared definitions, and a shared understanding of what produces revenue, instead of pursuing separate targets on separate scoreboards. Kotler, Rackham, and Krishnaswamy described the underlying problem in Harvard Business Review in 2006: each group undervalues the other's contributions, and organizational performance suffers when the two are out of sync. Alignment is what fixing that is supposed to produce.
How do you align sales and marketing?
Three practices carry most of the weight. Set shared goals and metrics, including a documented definition of what qualified means that both teams would defend. Establish regular communication, the standing meeting, the joint planning session, and an SLA that formalizes what each team owes the other. And map the customer journey together, so the handoff and its gaps are explicit. Gartner found organizations collaborating cross-functionally on enablement are 2.4x more likely to achieve strong commercial growth, so this genuinely works.
Why aren't sales and marketing aligned?
Usually, because they are reading two different pictures of the same revenue, and both pictures are accurate. Marketing's systems hold the top of the motion, sales hold the bottom, and neither holds the whole. So both teams reconstruct the quarter from the half they have, both are correct about that half, and the disagreement recurs regardless of how good the relationship is. This is why twenty years of communication-focused advice hasn't resolved it: the problem is structural, not behavioral.
Does an SLA between sales and marketing work?
Yes, and it is insufficient. An SLA formalizes what each team owes the other and when, which ends a genuine category of friction: unowned handoffs, unstated assumptions, surprises. That is real value, and the practice is not useless. What an SLA cannot do is resolve a disagreement where both parties are correct. If marketing and sales attribute the same quarter differently and both numbers are correctly pulled from correctly integrated systems, no service agreement reconciles them, because the disagreement isn't about service.
What is smarketing?
Smarketing is a portmanteau of "sales" and "marketing" that circulated widely in the 2010s, describing the practice of running the two functions as one aligned motion, shared goals, shared definitions, shared meetings. It names the same thing this article calls alignment, and the same playbook applies to it. The term has largely faded from analyst and academic usage, while the underlying question remains open.
Will AI fix sales and marketing alignment?
Not if it is layered onto two separate pictures. Gartner's research found that the organizations getting value from AI are "not simply layering AI onto existing ways of working", they are redesigning workflows so the system can execute and orchestrate. An AI reading marketing's half produces marketing's answer faster; an AI reading sales' half does the same for sales. You get the identical disagreement, arriving sooner and with more confidence. The prerequisite is one connected picture, not a smarter reader of two.
What is a Revenue Graph?
A Revenue Graph is the connected picture of what actually drives revenue, the relationships between touches, signals, accounts, and outcomes held as one structure, rather than divided across the systems that each recorded one part. It is not a dashboard over two datasets; it is one substrate underneath them. Its practical consequence for alignment: when there is one picture, attribution is inspected rather than negotiated, and efficiency becomes measurable as Cost per Outcome instead of as each team's activity against its own scoreboard.
Revenue Graph Audit
90-day audit, we will show you exactly where the ROI is hiding in your current stack. We'll map how revenue actually moves through your motion, and why your last QBR produced two numbers instead of one.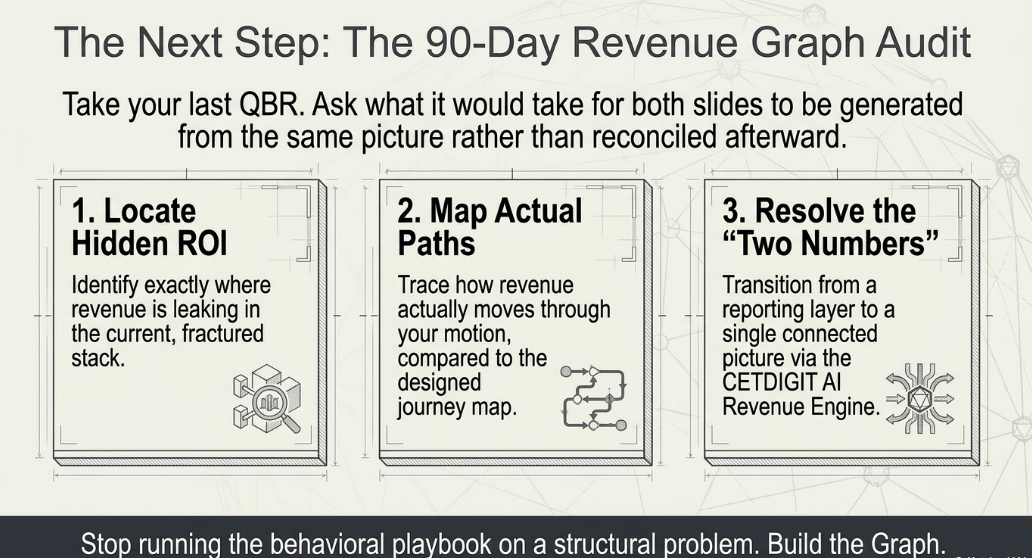



Leave a Comment