

Abstract:
The most necessary topic for all the levels of business management of any organization is a “Report”. One of the key factor why organizations use Salesforce is the capability to get the most understanding of how group are performing, by means of minimal number of clicks. Salesforce new customer platform known as Salesforce Lightening Platform has opened entryways for analysts, experts, executives and clients to tell a superior story with records. In this article, I have discussed the most important hints you can use to get progressively out of Lightening reports and Dashboards. If your organization is new to Salesforce, or your organization has recently switched to the Lightening platform, these 5 tips will surely help them to achieve their goal.
Tips for Salesforce Users
1. Applying Interactive filter
Do you have various groups separated by nation, region, or industry?
Lightning Reports facilitate its clients to choose interactive filters. Whether it is seeing by a timespan, sales and trades groups, or any other group to enable groups to understand style flow and performance.
Let suppose, you are constructing a Global Dashboard which can be access by all levels of supervisors in various jobs. For visual comparison of different nation’s group performances, a director that is overseeing and manage teams from different nations can easily utilize dashboard filters to switch views between various nations. Furthermore, it’s another great feature is data sharing in the job progressive system is regarded.
For instance, a country manager in the role hierarchy get to bind to information for the county they are responsible for might be viewing only the information related to their particular teams or groups.
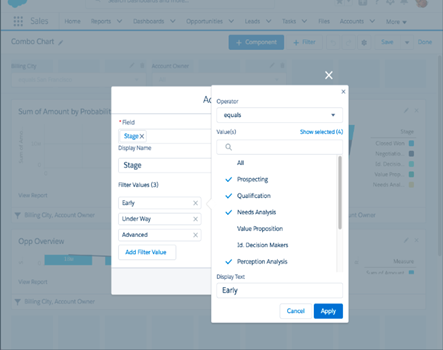
Steps for creating filters in Dashboard:
To start creating filters in Dashboards, you have to perform the following steps:
• Click on plus (+) Filter option and search for the attribute that you want to filter by.
• Input the name for your filter that you want to Display, using filter values.
• If you want to display some text different from the value in Salesforce, then input the display text as well.
Consider the following image;
2. Stacked Summaries
Stacked summaries are empowered as default with the upgraded Lightening Report Builder. For a faster review and evaluation, clients can easily summarize a large amount of data.
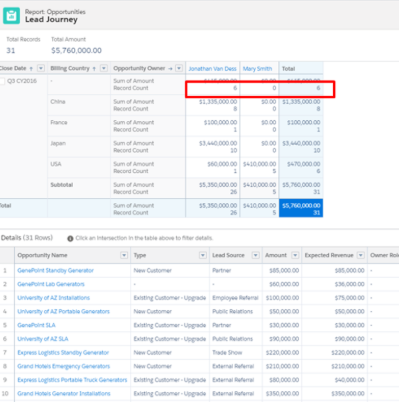
For instance, if you need to display the huge number of opportunities that are closed won, along with the sub- aggregate of Closed won opportunities by every nation, stacked summaries activated at the base or bottom of your report page can be used for this task. You can see record computation by every nation, each and every opportunity holder or other sub-total counts that the report is gathered by.
3. Build Reports Using Columns and Rows
Lightening Reports and dashboards provide its users the facility to now choose what rows and columns to display. Swap option for rows and columns is also available to view the better optimization that what works best.
For instance, you are creating a report and selects your row as “opportunity owner” and column as “opportunity revenue”. While creating the report, you recognized the number of more suitable and convenient opportunity owners to display as columns to empower printing with the remaining files into your yearly report. To save your valuable time, you simply hit “Swap rows and column” option rather than drag and drop fields turn by turn to make this variation.
4. Dynamic Reports using on-the-fly filter
This dynamic report option of Lightening report is really an amazing feature which allow users to view an entire report with a different filter without any editing.
With the Lightning Report Filter function, users are allowed to easily adjust any filter of their choice even after the report is run.
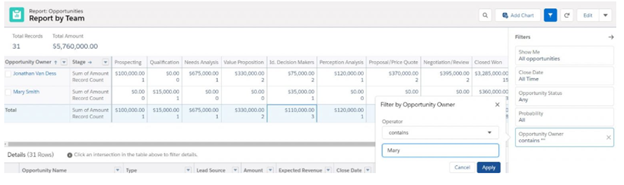
For instance, an access to a report is provided to you across your association’s top management. Different shareholder within that particular management team require to toggle different opinion and interpretations of the report themselves, to meet their interests and benefits. Instead of saving numerous versions of an equivalent report, you can just create a filter for that report in an easiest way and leave the filter value option blank. In this way, users can be able to create a dynamic report which spectators can enter filters and run report quickly. The main structure or theme of the report can be prevented from editing by other users.
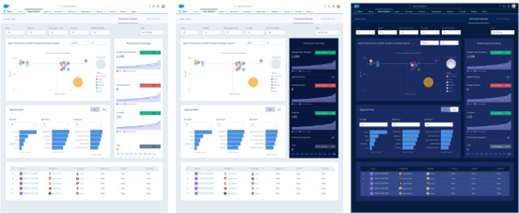
5. Setting up Light vs. Dark Mode for Lightning Dashboards
In Lightening Reports, there is another amazing option to differentiate dashboard components. There are 2 types of modes generally Light and dark mode per module. It also have a different color palette so that the most significant data will be drawn by the report spectators.
Let’s take an example, you have been creating a number of dashboards for the sales department. To display the more eye-catching view for dashboard displaying actual income versus target income, you simply go to the properties at the right most corner of the dashboard, and then choose a different dashboard theme or palette by scrolling down to the bottom of the page.
Summary:
On summing up, 5 most necessary and crucial tips can be covered in this article you can use to get progressively out of lightening reports and Dashboards. By utilizing these tips, you will be able to achieve you goal and become a more successful Salesforce user, and in most effective manner getting the data you need and tell a better story with the information.


Leave a Comment